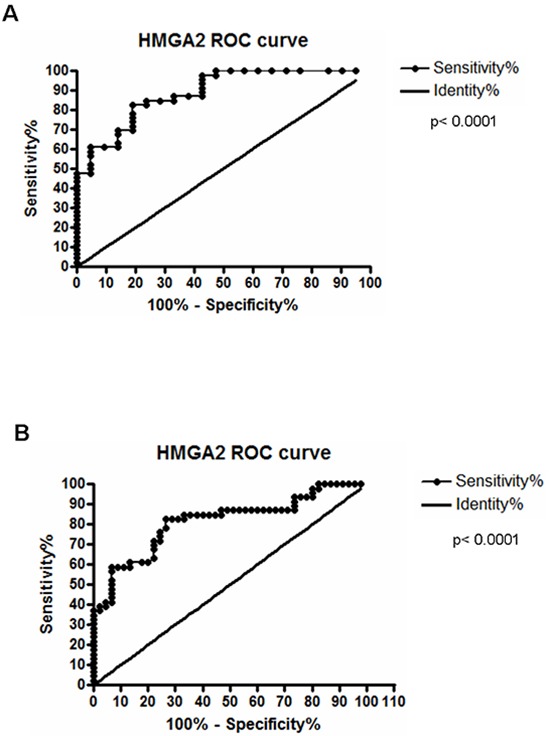
Figure 2. Receiver Operating Characteristc (ROC) analyses.

A. Discrimination of healthy esophageal tissue (n=7) from ESCC samples with 82.61% of sensitivity and 80% of specificity, at a cut-off point of 0.0002329 (area under the curve = 0.8872). B. Discrimination of histologically normal surrounding mucosa (n=52) from their paired ESCC samples, being the area under curve (AUC) = 0.8145; Sensitivity = 82.61% and Specificity = 73.33%, at a cut-off point of 0.0002310 (B). Both curves are relative to HMGA2 mRNA expression.
