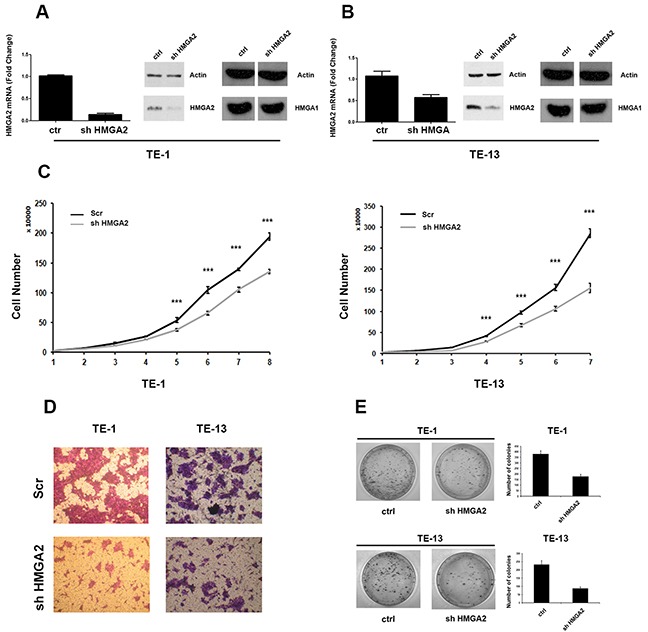
Figure 4. HMGA2 silencing inhibits TE-1 and TE-13 cells growth and migration.

A. qRT-PCR analysis of HMGA2 levels (left panel) and western blot analysis (right panel) of HMGA2 and HMGA1 levels in shHMGA2 transfected TE-1 cells compared to scrambled vector. B. qRT-PCR analysis of HMGA2 levels (left panel) and western blot analysis (right panel) of HMGA2 and HMGA1 levels in shHMGA2 transfected TE-13 cells compared to scrambled vector. C. TE-1 (left panel) and TE-13 (right panel) cell proliferation in shHMGA2 transfected cells compared to scrambled vector. D. Cell migration assay of TE-1 and TE-13 cells transfected with shHMGA2 or with scrambled vector. E. Colony formation assay of TE-1 and TE-13 cells transfected with shHMGA2 or with scrambled vector. The number of colonies was quantified by using Quantity One software. *** p < 0,005.
