
Figure 2. Cyp expression and DNA damage in Hif-1αLysM−/− mice.
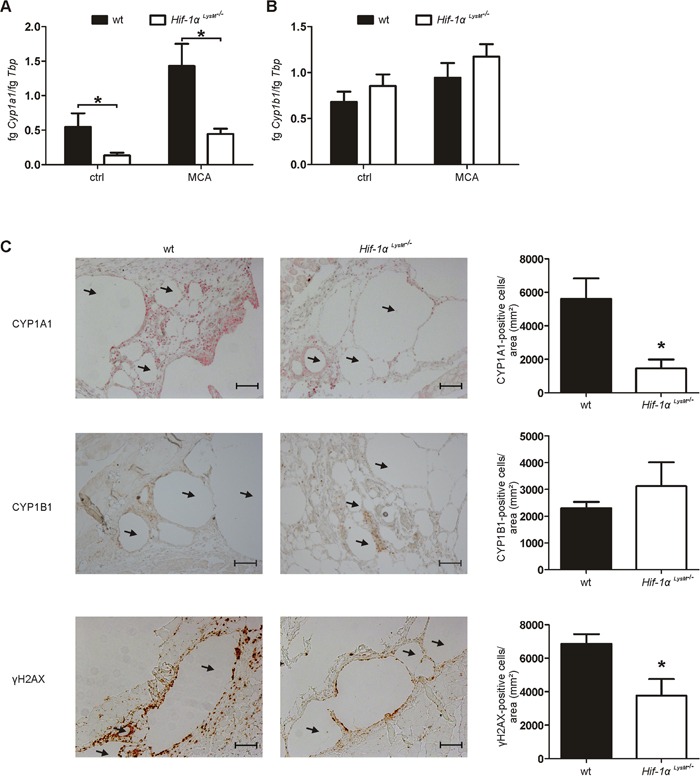
A. Cyp1a1 and B. Cyp1b1 mRNA expression in whole skin tissue in close proximity to MCA-injection sites 5 days after application was assessed by qPCR. mRNA levels were normalized to Tbp. Values give the mean ± SEM of n = 7. * P < 0.05. C. Representative images and quantification of skin sections 5 days after MCA-injection, stained for CYP1A1 (red), CYP1B1 (brown) and γH2AX (brown) by immunohistochemistry. Arrows indicate lipid droplets. Scale bars: 100 μm. Values are the mean ± SEM of n = 3 (HIF-1αLysM−/−)/ 4 (wt), * P < 0.05 compared to wt.