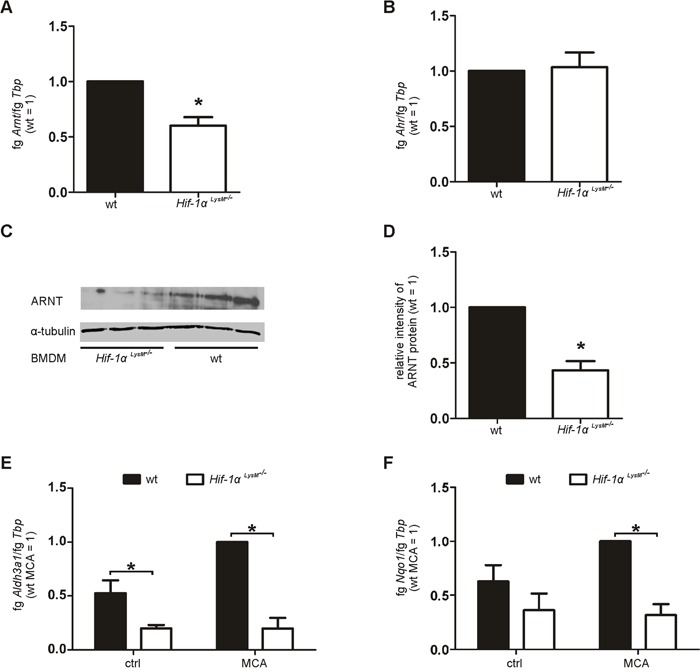
Figure 5. Reduced Arnt expression in Hif-1αLysM−/− macrophages.

A. Arnt and B. Ahr mRNA expression in PMs isolated from wt and Hif-1αLysM−/− mice assessed by qPCR. mRNA levels were normalized to Tbp. The ratio of Arnt or Ahr and Tbp in wt mice was set to 1. Values are the mean ± SEM of n = 4 (each n contains 3 mice/genotype). * P < 0.05 compared to wt. C. Representative Western analysis of ARNT protein in BMDMs isolated from wt and Hif-1αLysM−/− mice. Tubulin served as a loading control. D. Quantification of ARNT protein expression. To quantitate the ARNT protein, band intensity of each experiment (3 mice per genotype) was measured. The medium intensities of wt BMDMs were set to 1 and compared to the medium intensities of Hif-1αLysM−/− BMDMs. Experiment including quantification was performed three times. E. Aldh3a1 and F. Nqo1 mRNA expression in PMs isolated from wt and Hif-1αLysM−/− mice, stimulated with MCA or DMSO (ctrl) for 8 h assessed by qPCR. mRNA levels were normalized to Tbp. The ratio of Aldh3a1 and Tbp in wt mice after stimulation with MCA was set to 1. Values are the mean ± SEM of n = 4 (each n contains 3 mice/genotype), * P < 0.05.
