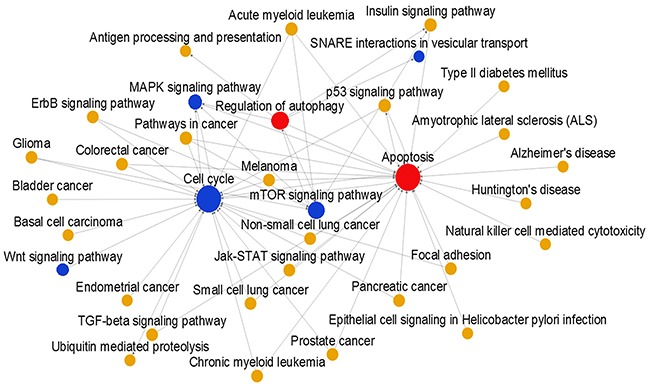
Figure 1. Signal pathway relation network in MCF-7 cells.

Red indicates upregulated, blue indicates downregulated, and yellow indicates unchanged pathways. The area of the circles indicates the value of betweenness centrality. Line segments indicate pathway-pathway interactions.
