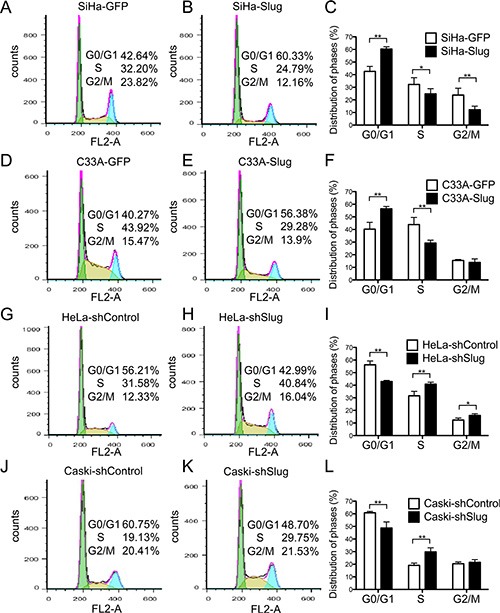
Figure 4. Expression of slug in cervical cancer cells hindered cell cycle transition from G1 to S phase.

The cell cycle was analyzed using flow cytometry, and a quantitative analysis of the cell cycle is shown. The cell cycles of SiHa-GFP (A) and SiHa-Slug cells (B) and the quantitative analysis are shown (C). The cell cycles of C33A-GFP (D) and C33A-Slug cells (E) and the quantitative analysis are shown (F). The cell cycles of HeLa-shControl (G) and HeLa-shSlug cells (H) and the quantitative analysis are shown (I). The cell cycles of Caski-shControl (J) and Caski-shSlug cells (K) and the quantitative analysis are shown (L). The data were shown as the mean ± SD of three independent experiments. *p < 0.05, **p < 0.01 vs. control using One-Way ANOVA.
