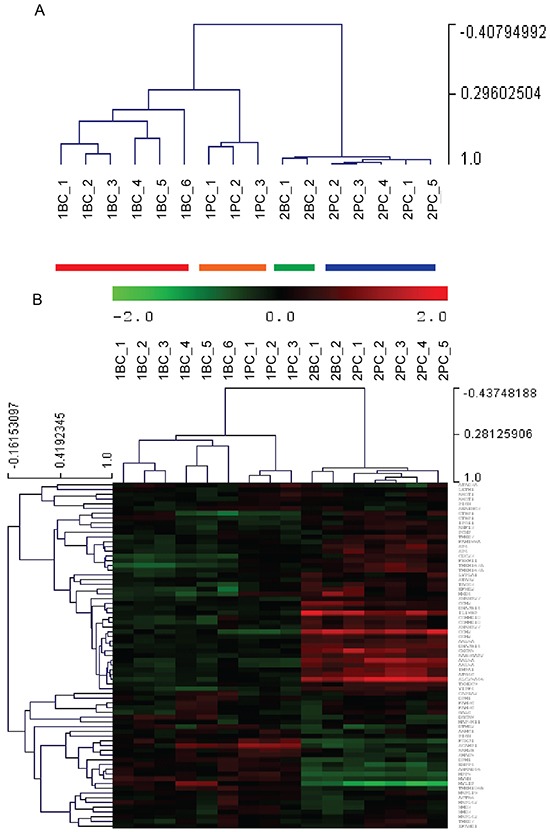
Figure 6. Global expression profiling of PDXs propagated from the two Patients’ samples harvested before and after chemotherapy.

A. Unsupervised hierarchical clustering shown as dendrogram (clustering tree) derived from expression levels of 11,866 gene probes in the individual PDXs obtained from Patient 1′s (#1BC and #1PC) and Patient 2′s (#2BC and #2PC) samples. Individual PDXs were numbered by the randomizing software. The vertical axis on the right shows the level of similarities between PDXs. B. Heat map showing the unsupervised hierarchical clustering of the PDXs by means of 73 genes, selected among the 129 genes which defined the profiles of platinum-sensitive versus the platinum resistant HGS-EOCs analyzed by Patch et al. [6].
