
Figure 2. Inhibition of STAT3 activities by C188 and C188-9.
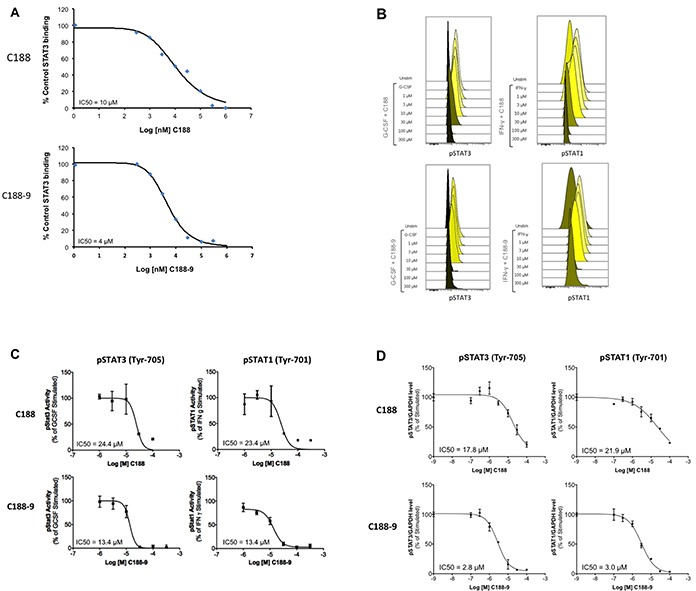
A. Inhibition of recombinant STAT3 (200nM) binding to Biacore sensor-chip-immobilized phosphododecapeptide ligand (12 amino acids surrounding and including pY1068 within EGFR) by C188 (0.1 to 1000 μM, top) and C188-9 (0.1 to 1000 μM, bottom) by SPR. The equilibrium binding levels obtained ± compound were normalized (resonance obtained in the presence of compound ÷ the resonance obtained in the absence of compound × 100) and plotted against Log [nM] C188 (or C188-9) and IC50 calculated (value shown in inlay). B. Inhibition of ligand-stimulated STAT phosphorylation, measured by phosphoflow. Serum-starved (1 hour) Kasumi-1 cells, pre-incubated with compound/DMSO (1 hour), were treated with G-CSF (10 ng/ml, 15 min, left two panels) or IFN-γ (10ng/ml, 15 min, right panel). Cells were permeabilized and stained with Alexa647-pSTAT3, and PE-pSTAT1 antibodies and analyzed on BD LSR2. FCS files were uploaded to Cytobank for pSTAT3 and pSTAT1 quantitation. Histograms depicting pSTAT3 and pSTAT1 levels are shown. C. Mean fluorescence (pSTAT3/1) levels were plotted as function the Log [M] compound, and IC50 calculated using GraphPad. 1D shows IC50 curve from representative experiments. D. Inhibition of ligand-stimulated STAT phosphorylation, measured by Luminex. Serum-starved (1 hour) Kasumi-1 cells, pre-incubated with compound/DMSO (0/0.1/0.3/1/3/10/100 μM, 1 hour), were treated with G-CSF (10 ng/ml, 15′). Total protein extracts of cells were assayed for pSTAT3, pSTAT1, and GAPDH levels by Luminex. GAPDH-normalized pSTAT3 or pSTAT1 values were divided by this ratio for untreated cells and expressed in percentage. These values were plotted as a function of Log [M] compound, and IC50 values calculated using GraphPad. Upper panel shows data from representative experiments with C188 and lower panel shows those with C188-9.