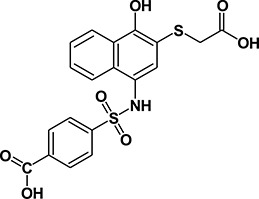
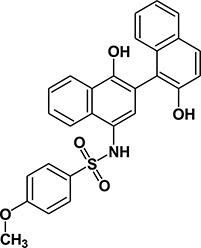
Table 1. Summary of features, activities, MTDs, and tumor PK of C188 and C188-9.
| Features | C188 | C188-9 |
|---|---|---|
| Chemical Features | ||
| Structure |  |
 |
| Log P | - | 5.2 |
| Solubility (μM)1 | - | 13.1 |
| Inhibitory Activity (Mean ± SEM, n ≥ 2) | ||
| STAT3-pY peptide binding (SPR) | 7.5 ± 3.5 | 2.5 ± 2.1 |
| Ki | 37.3 nM | 12.4 nM |
| Ligand stimulated phosphorylation (Phosphoflow) | ||
| pSTAT3 (G-CSF) | 16.8 ± 20.1 | 8.9 ± 5.8 |
| pSTAT1 (IFNγ) | 15.0 ± 0.0 | 9.5 ± 5.6 |
| G-CSF Induced Phosphorylation (Luminex) | ||
| pSTAT3 | 16.2 ± 2.3 | 3.7 ± 1.9 |
| pSTAT1 | 18.6 ± 4.7 | 4.1 ± 3.3 |
| Constitutive pSTAT HNSCC cells | ||
| UM-SCC-17B | ||
| pSTAT3 | 15.4 ± 9.2 | 10.6 ± 0.7 |
| Anchorage dependent growth (MTT) | ||
| UM-SCC-17B | 6.3 ± 0.8 | 3.2 ± 0.6 |
| MTD (mg/Kg/day) | ||
| Mice: 14 days | 100 | 100 |
| Plasma PK: IP and oral (10 mg/Kg) | ||
| Area under the curve (AUC, IP/oral, μg-hr/mL) | ND | 12.5/12.5 |
| Tumor PK: IP (10 mg/Kg; mouse) | ||
| Tumor level/plasma level (mg/ml [μM])2 | ND | 5.0 [10.4]/ 1.9 [4.0] |
| Tumor: Plasma ratio | ND | 2.6 |
ND: Not Done; Cells used: G-CSF induced pSTAT3 and IFN-γ induced pSTAT1 by Phosphoflow: Kasumi-1, G-CSF induced pSTAT/GAPDH by Luminex (Kasumi1),
60 min at 37°C in PBS, pH 7.4,
Tumor and plasma harvested 1 hr following IP dose.
