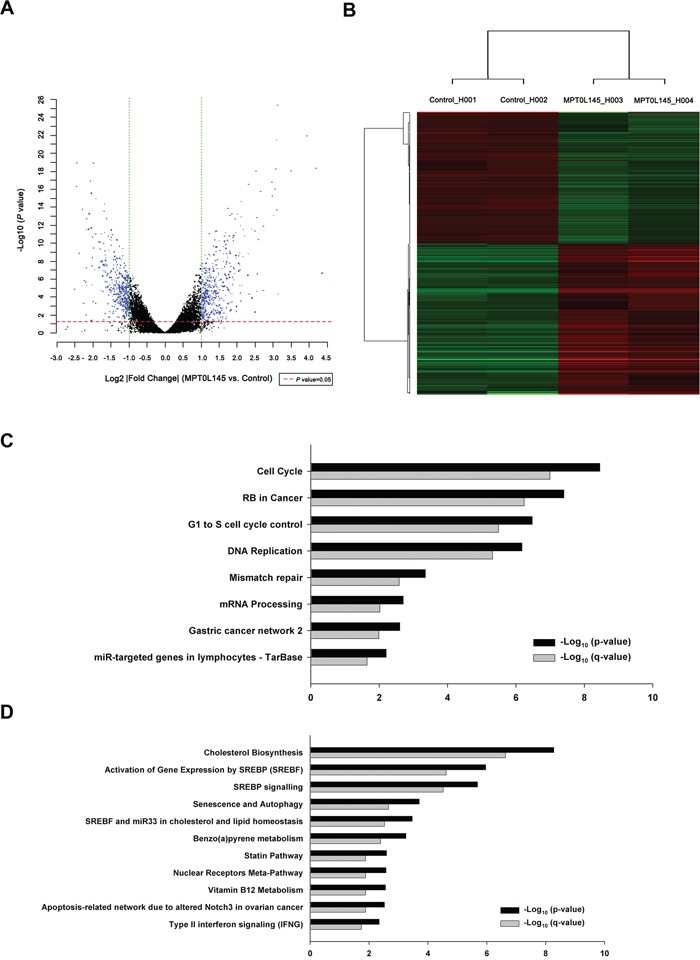
Figure 3. Differentially expressed genes and pathway analysis in MPT0L145-treated cells.

RT-112 cells were treated with MPT0L145 (4 μM) for 8 h. Total RNA was extracted and subjected to cDNA microarray analysis. A. Volcano plot, B. Clustering, C. Pathway analysis for downregulated genes. D. Pathway analysis for upregulated genes.
