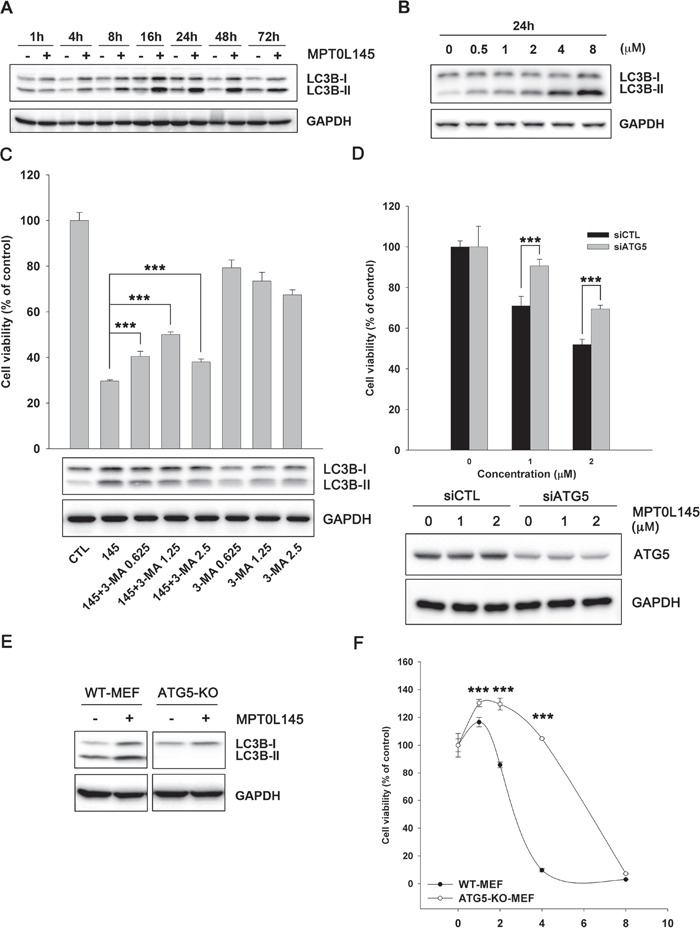
Figure 5. Contribution of autophagy to MPT0L145-induced cell death.

RT-112 cells were treated with MPT0L145 (4 μM) for the indicated times A. or different concentrations for 24 h B., and protein lysates subjected to western blot analysis. C. RT-112 cells were treated with MPT0L145 (4 μM) in the presence or absence of autophagy inhibitor, 3-methyladenine (3-MA, 0.625~2.5 mM). Cell viability was assessed with the MTT assay (upper panel). Data are expressed as means ± S.D. (***P < 0.001 compare to MPT0L145 alone). Protein lysates were subjected to western blot analysis (lower panel). D. RT-112 cells were transiently transfected with indicated siRNA for 24 h and then treated with MPT0L145 for 72 h. Cell viability was assessed with the MTT assay (upper panel). Data are expressed as means ± S.D. (***P < 0.001, siCTL v.s. siATG5). Protein lysates were subjected to western blot analysis to show the knockdown efficiency (lower panel). E. Wild-type (WT) MEF and ATG5 knockout (KO) MEF were treated with MPT0L145 (4 μM) for 24 h, and protein lysates subjected to western blot analysis. F. WT MEF and ATG5-KO-MEF were treated with different concentrations of MPT0L145 for 72 h. Cell viability was assessed with the MTT assay. Data are expressed as means ± S.D. (***P < 0.001, WT-MEF v.s. ATG5-KO-MEF).
