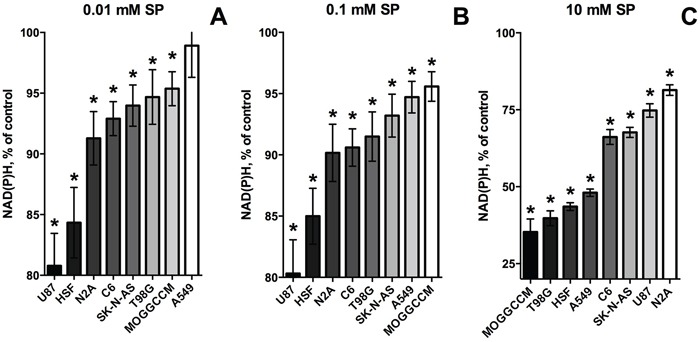
Figure 2. Change in relative sensitivity of different cell lines to SP with increasing SP concentrations.

Data of Figure 1A and 1B were used to range the cell lines according to the strength of their response to the SP exposure (96 h). The strength is colored in shades of grey. Statistical significance of the decreases in viability against the corresponding controls (*, p≤0.05) was determined by two-way analysis of variance (ANOVA) followed by Tukey test for multiple comparisons. A. SP 0.01 mM. B. SP 0.1 mM. C. SP 10 mM.
