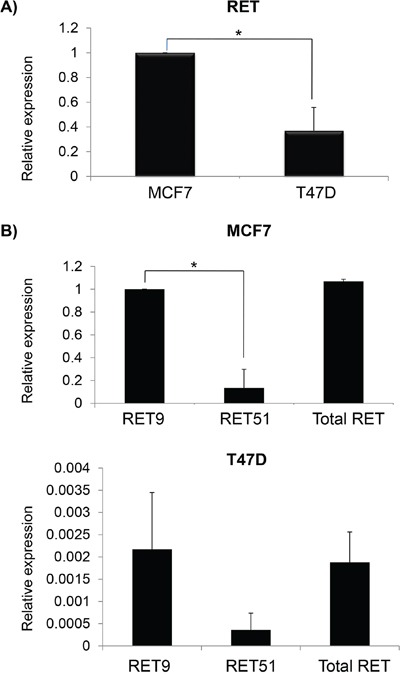
Figure 1. Differential expression of total RET and its isoforms in breast cancer cell lines.

A. Relative basal RET mRNA levels in MCF7 (equal to 1) and T47D. B. mRNA quantification of RET9 and RET51 isoforms in MCF7 (top) and in T47D (bottom). Values are the mean ±SD of at least two independent experiments performed in triplicate; asterisks (*) indicate statistically significant differences (*p<0.05; **p<0.01).
