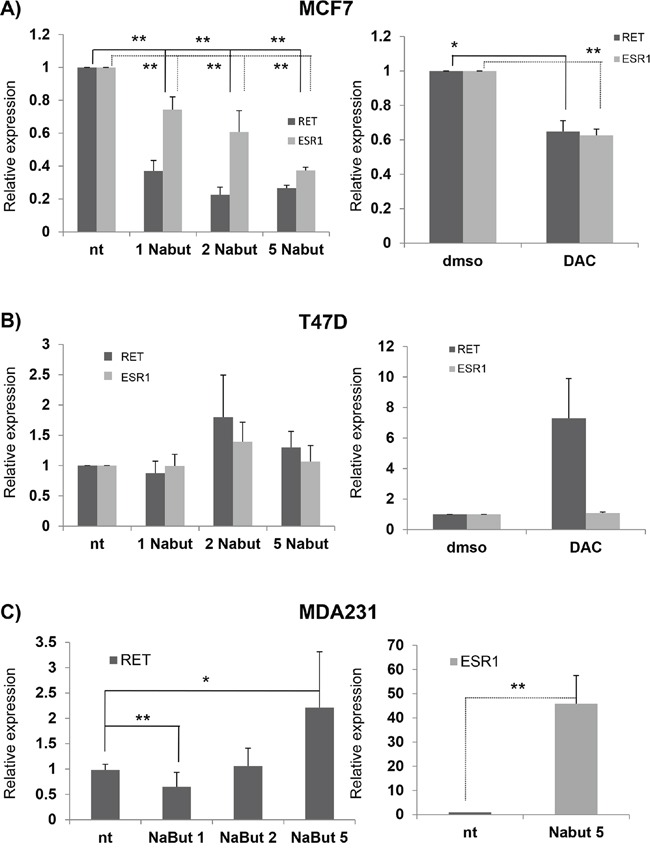
Figure 5. HDAC inhibitors and RET expression in breast cancer cell lines.

mRNA expression of RET and ESR1 in MCF7 A. and T47D B. cells after treatment with 1, 2, 5 nM Nabut (left panel, normalised to untreated cells) and 10uM 5-Aza-2′-deoxycytidine (DAC) (right panel, normalised to DMSO treated cells). RET and ESR1 expression levels in MDA231 upon Nabut treatments are reported in the left and right C panels respectively. Values are the mean ±SD of at least two independent experiments performed in triplicate; asterisks (*) indicate statistically significant differences (*p<0.05; **p<0.01).
