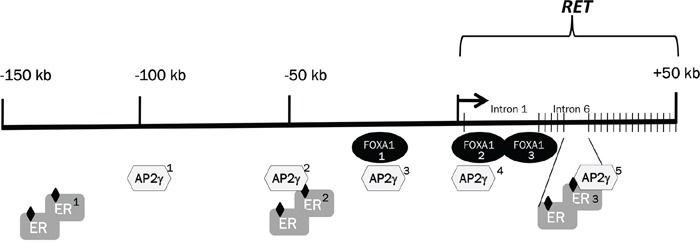
Figure 7. Selected transcription factors and positional map of their binding sites at the RET locus.

Schematic representation of the 150 kb upstream of the RET gene followed by the 50 kb of the RET genomic region. The localization of ER and FOXA1 candidate binding regions has been obtained from the UCSC browser, while the five TFAp2C positions were published by Tan et al. [37]
