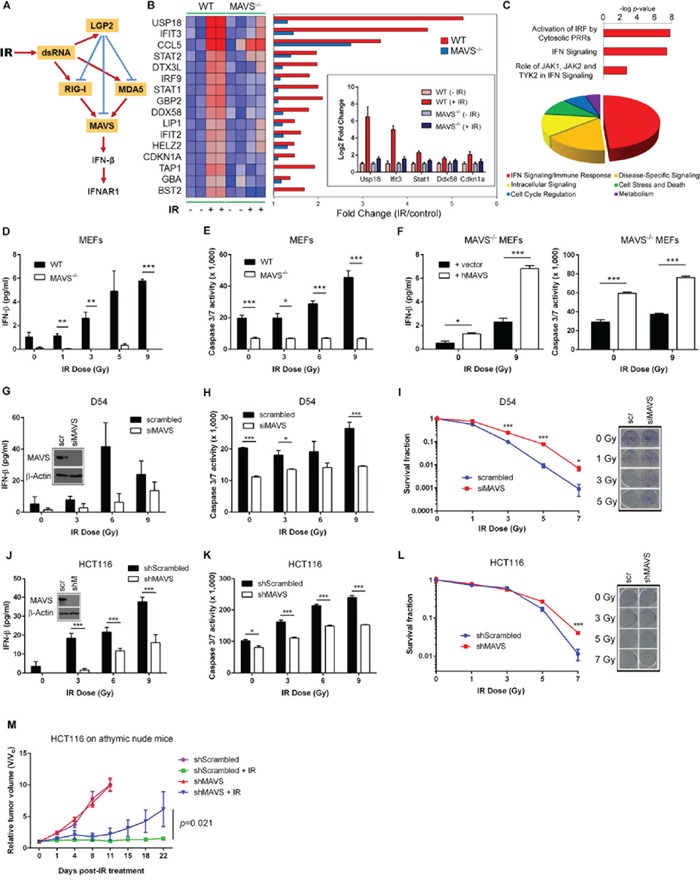
Figure 1. MAVS is necessary for ionizing radiation-induced Type I interferon signaling.

A. Proposed mechanism of MAVS-dependent activation of Type I IFN signaling in the cellular response to IR. B. Transcriptional profiling of C57BL/6 wild-type (WT) and MAVS−/− primary MEFs demonstrating MAVS-dependent expression of Type I IFN-stimulated genes (ISGs) 48 hours following exposure to IR (6 Gy). Heatmap displays differences in gene expression values between WT and MAVS−/− MEFs; red indicates high expression and blue low expression. Inset shows qRT-PCR validation of Usp18, Ifit3, Stat1, Ddx58, and Cdkn1a gene expression values in WT and MAVS−/− MEFs after IR treatment. C. Top-ranked cellular pathways (top) and functions (bottom) (Ingenuity Pathway Analysis) activated by IR in WT MEFs. Pie-chart displays the relative abundance of each functional category among all significant functions (P < 0.05). IRF – interferon regulatory factor; PRR – pattern recognition receptor; JAK – Janus kinase; TYK – tyrosine kinase. IFN-beta protein secretion D. and caspase 3/7 activity E. in WT and MAVS−/− MEFs 48 hours following exposure to increasing doses of IR. F. IFN-beta protein secretion and caspase 3/7 activity 48 hours following IR exposure of MAVS−/− MEFs reconstituted by transient transfection of a full-length human MAVS construct (hMAVS) or an empty vector control (vector). IR-induced IFN-beta G., caspase 3/7 activity H. and clonogenic survival I. following siRNA-mediated suppression of MAVS (siMAVS) in human D54 glioblastoma cells. Scr - scrambled siRNA control. IR-induced IFN-beta J., caspase 3/7 activity K. and clonogenic survival L. following stable shRNA-mediated suppression of MAVS (shMAVS) in human HCT116 colorectal carcinoma cells. Depletion of MAVS increased Do values (dose required to reduce the fraction of surviving cells to 37%) from 1.01 ± 0.02 Gy to 1.43 ± 0.1 Gy (P=0.0025) in D54 and from 1.67 ± 0.22 Gy to 2.36 ± 0.09 Gy (P=0.0074) in HCT116 cells. Western blot analysis and representative scanned images of culture dishes after MAVS depletion and subsequent IR treatment are shown in the insets for (G), (I), (J), and (L). shM – shMAVS. Data are representative of three independent experiments. M. Relative tumor growth of shMAVS HCT116 tumor xenografts in athymic nude mice treated with IR (5 Gy x 6 daily fractions). Data are representative of two experiments, each with n = 5 mice per group. P values were determined using unpaired Student's t-test. Error bars are SEM. *P < 0.05, **P < 0.01, ***P < 0.005.
