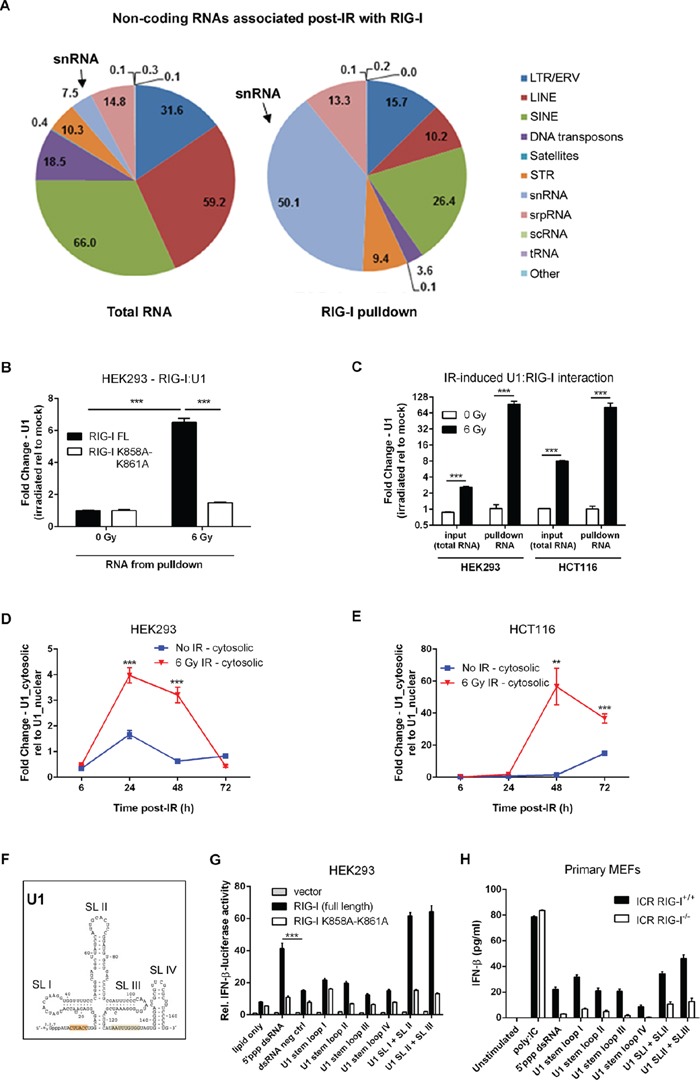
Figure 5. RIG-I binds U1 snRNA accumulated in the cytoplasm to mediate radiation-induced IFN-beta response.

A. RIG-I binds diverse non-coding RNA molecules, majority of which are snRNAs. Graphic representation indicating the distribution of non-coding and repetitive RNA molecules bound to RIG-I following exposure to IR as compared to total irradiated cellular RNA. Transcripts were mapped to reference genomes using RepeatMasker. See Methods for further details. B. qRT-PCR quantification of U1 RNA from purified RNA bound to ectopically expressing WT and K858A-K861A mutant RIG-I HEK293 cells exposed to IR (6 Gy) or left untreated. Cells were UV crosslinked at 150mJ/cm2 48 hours post-IR treatment prior to cell lysis. U1 RNA levels were normalized to the geometric average of 3 housekeeping genes (18S rDNA, GAPDH, and β-actin). Fold change was determined relative to un-irradiated controls. C. U1 RNA levels quantified by qRT-PCR from total cellular and RIG-I pulldowns in RIG-I overexpressing HEK293 and HCT116 cells. U1 RNA levels were normalized to the geometric average of 3 housekeeping genes (18S rDNA, GAPDH, and β-actin). Fold change was determined relative to un-irradiated controls. Time course of cytosolic accumulation of U1 RNA measured by qRT-PCR from purified total cellular RNA following cellular fractionation of nuclear/mitochondrial and cytoplasmic fractions of HEK293 D. and HCT116 cells E. exposed to IR (6 Gy) or left untreated. F. The structure of the U1 snRNA illustrating the four stem loop (SL) regions. G. Relative IFN-beta luciferase reporter activity of HEK293 cells following a 24 hour stimulation with synthetic oligonucleotides corresponding to U1 RNA stem loop (SL) regions I to IV or a combination of SL I + II and SL II + III. H. IFN-b levels in culture supernatant from ICR RIG-I+/+ and RIG-I−/− primary MEFs 24 hours post-stimulation with the same set of synthetic U1 oligonucleotides used in G. The amount of U1 synthetic oligonucleotides used in all stimulation experiments was 1μg. P values were determined using unpaired Student's t-test. Error bars are SEM. ***P < 0.005.
