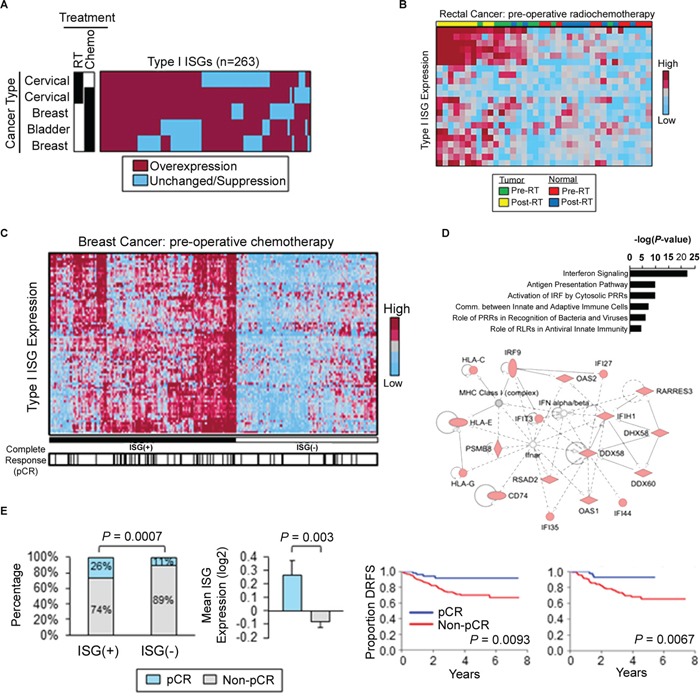
Figure 6. Radiation and chemotherapy activate Type I interferon-stimulated genes in cancer patients.

A. Heatmap displaying the commonality of Type I ISG induction in human cervical, breast, and bladder cancers following genotoxic treatment. Black boxes denote treatment. Gene expression values were obtained from microarray analysis of matched pre- and post-treatment tumor biopsies. Overexpression defined as fold-change > 1 in post-treatment biopsies as compared to matched pre-treatment biopsies. B. Type I ISG expression in pre- and post-chemoradiation specimens of human rectal cancer and matched normal tissue. C. Type I ISGs (n=81) distinguish breast cancer patients (GSE25055, n=310). ISG(+) defined by overexpression of type I ISGs (left). Black hash marks denote complete pathologic response (pCR) to pre-operative doxorubicin-based chemotherapy. D. Canonical pathways (top) and top-ranked gene network (bottom) from Ingenuity Pathway Analysis of Type I ISGs identified in (C). E. (Left) Frequency of pCR in ISG(+) and ISG(-) breast cancers treated with pre-operative doxorubicin-based chemotherapy. P value was determined by using Fisher's exact test. (Middle) Mean ISG expression (81 genes) in breast cancers which achieved a pCR to pre-operative chemotherapy vs. tumors with residual disease (non-pCR). P value was determined by using unpaired Student's t-test. Error bars are SEM. (Right) Kaplan-Meier estimates of distant relapse-free survival (DRFS) in breast cancer patients with a pCR vs. non-pCR. Left: GSE25055 (n=310); right: GSE25065 (n=198). P values were determined by using log-rank tests.
