
Figure 2. miR-520g promoted EOC cell proliferation and cell cycle transition in vitro and in vivo.
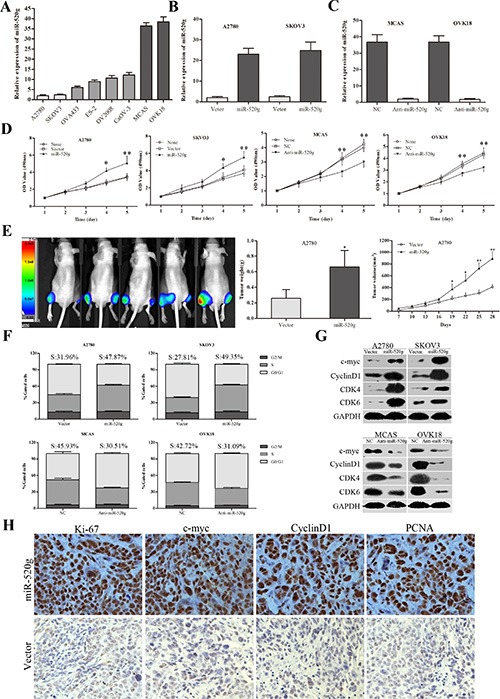
(A) Relative miR-520g expression in eight EOC cell lines. (B) miR-520g was upregulated after transfection with miR-520g overexpression vector. (C) miR-520g was downregulated after transfection with anti-miR-520g vector. (D) miR-520g overexpression or knockdown resulted in increased or decreased EOC cell proliferation, respectively, in vitro. (E) Animal in-Vivo Imaging System showed miR-520g upregulation promoted growth tumor xenograft growth in nude mice. Tumor volumes were measured by In-Vivo Imaging System weekly. After four weeks, xenograft weight and volume curves were compared with controls (n = 5, *p < 0.05, **p < 0.001; Left, miR-520g overexpression; Right, vector control). (F) Cell cycle analysis using FACS. Overexpression or knockdown of miR-520g induced or inhibited the G1 to S phase transition, respectively (p < 0.001). (G) Altered cell cycle-related proteins after miR-520g overexpression or knockdown in vitro. (H) IHC staining analysis for Ki-67, c-myc, cyclinD1 and PCNA in the miR-520g overexpression and control groups in tumor xenografts.