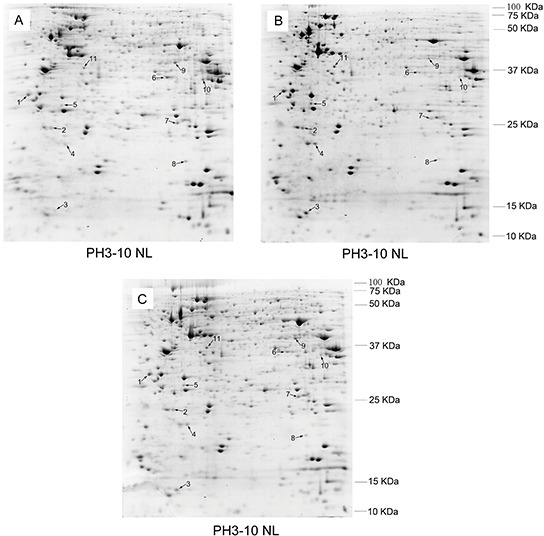
Figure 2. Comparison of the protein expression patterns between K562.

A. and the revertant K562/ADM cells B. and the revertant K562/ADM cells C. The proteins were separated by two-dimensional electrophoresis and stained with Coomassie brilliant blue G250. Identified protein spots are indicated by numbers.
