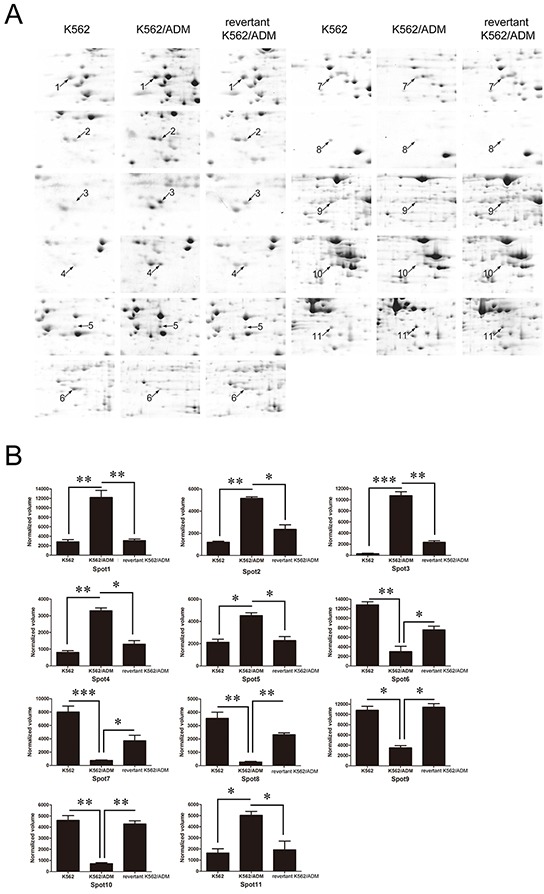
Figure 3.

A. Enlarged maps of the protein spots differentially expressed among K562, K562/ADM, and the revertant K562/ADM cells. B. Graphical representation of spot intensities assigned by PDQuest 8.0 software subsequent to normalization. The graphs show the intensities of the protein spots differentially expressed among K562, K562/ADM, and the revertant K562/ADM cells. *p<0.05, **p<0.01, ***p<0.001.
