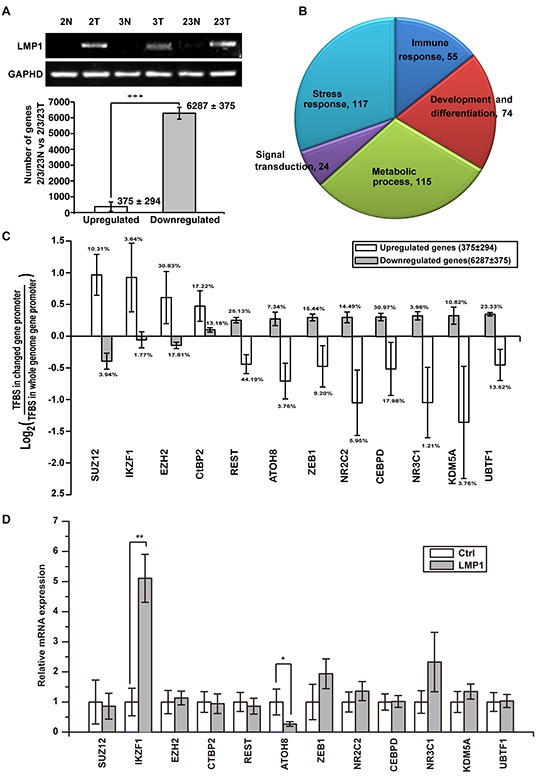
Figure 2. Widespread gene repression in LMP1-positive NPC contributes to tumorigenicity.

A. six RNA libraries from three paired primary NPC tumors (2T, 3T, 23T) as well as adjacent non-tumor (2N, 3N, 23N) tissues were analysed by unbiased RNA-seq assays. 6287 genes were down-regulated and 375 genes were up-regulated in all three NPC patient samples compared with paired adjacent nontumor tissues. B. DAVID Gene Ontology (GO) analysis of the dysregulated genes match to the functions of development and differentiation, immune responses, stress responses, signal transduction and metabolic process. C. transcription factor binding site (TFBS) enrichment analysis found a subset of TFBSs inversely enriched in up-regulated genes and down-regulated genes. D. the expression of the enriched transcription factors were examined in EBV negative NPEC or NPC cell lines NPEC1, NPEC2, CNE1 and HNE2 with or without overexpressed LMP1. *p < 0.05, **p < 0.01, ***p < 0.001, two-tailed Student's t-test.
