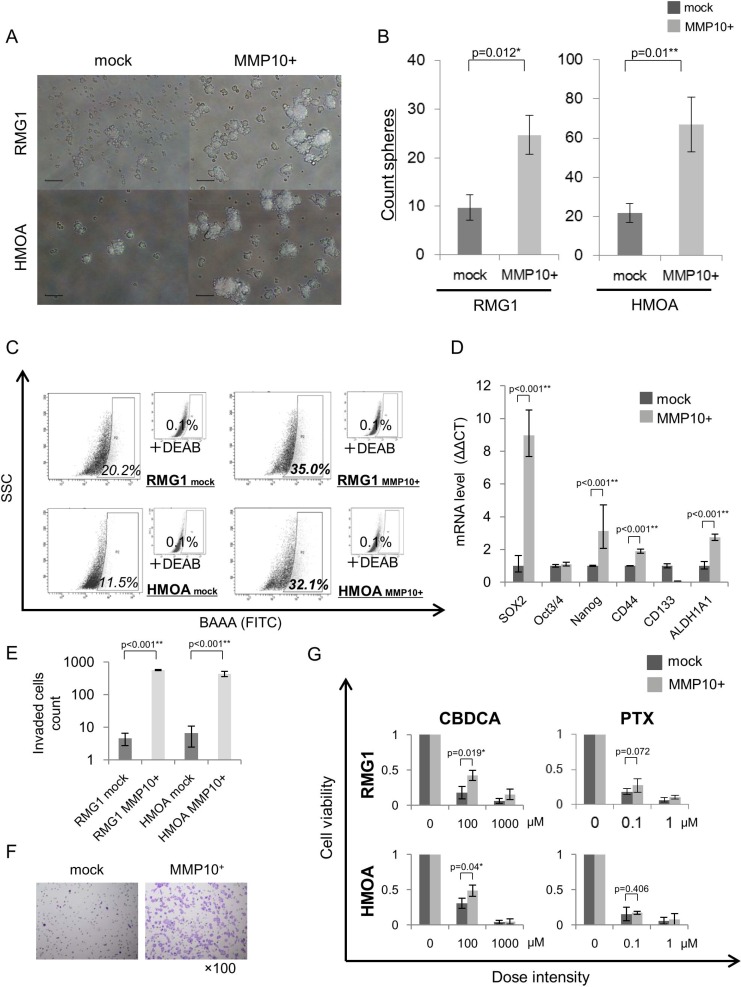
Figure 2. Phenotypes of MMP10-overexpressed cells.
(A) Sphere formation of mock- and MMP10-transfected cells. Seven-day-cultured mock- and MMP10-transfected cells of RMG1 (upper) and HMOA (lower) cell lines under × 100 magnification light microscopic view. Bar scales are 100 μm. (B) Sphere-forming assay for mock- and MMP10-transfected cells. Data are shown as means ± SD. (C) ALDEFLUOR assay of mock- and MMP10-transfected cell lines. (D) Expression of stem cell-related genes in mock- and MMP10-transfected cells. Expression levels of stem cell-related genes were examined by quantitative PCR using the ΔΔCT method. Significantly up-regulated genes in MMP10-transfected cells are shown in the figure. Data are shown as means ± SD. (E-F) Matrigel invasion assay for mock- and MMP10-transfected cell lines. Numbers of mock- and MMP10-transfected cells in each of the cell lines, RMG1 and HMOA, are listed in bar graphs in figure E. Data are shown as means ± SD. In figure F, HE-stained membranes of tested columns are shown in ×100 magnification. (G) Resistance of mock- and MMP10-transfected cells to chemotherapeutic agents. Calculated cell viability after 48 hrs of treatment with paclitaxel (PTX) and carboplatin (CBDCA) is shown in bar graphs. X-axis is dose intensity of each agent. Y-axis is calculated cell viability from counted number of surviving cells. Data are shown as means ± SD. All statistical analyses for this Figure were performed using bilateral Student's t test. P-values are shown as follows: *< 0.05, **< 0.01.

