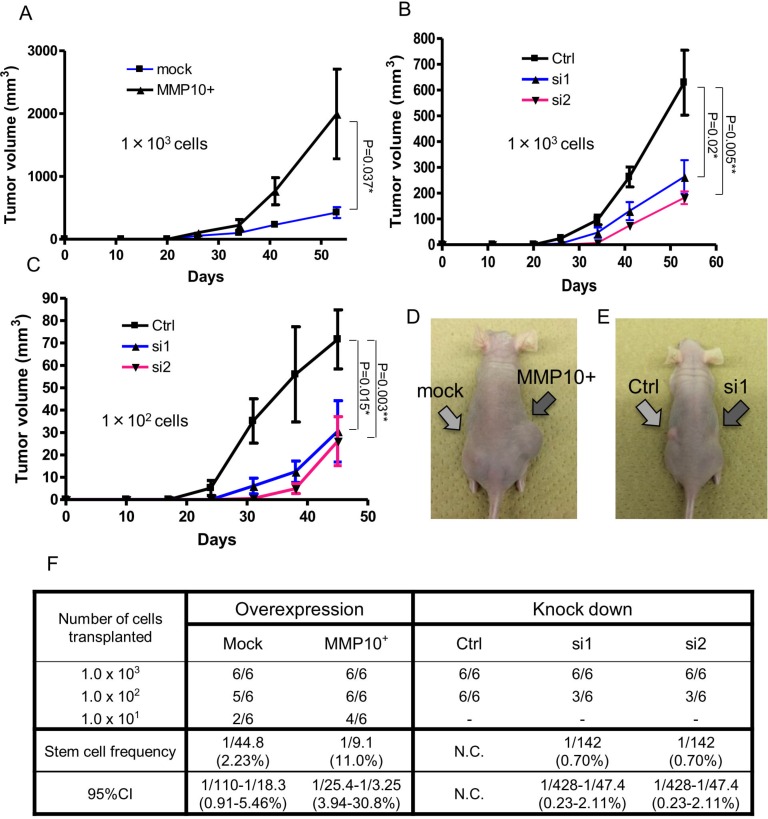
Figure 4. Tumorigenicity in vivo xenograft and limiting dilution assay.
(A-C) Tumor growth curves of cells injected into nude mice. Tumor volume in mice in which cells had been injected was checked every week. A: mock and MMP10-overexpressed cells, 1 × 10³ cells injected. (B) Ctrl, si1 and si2 cells, 1 × 10³ cells injected. (C) Ctrl, si1 and si2 cells, 1 × 10² cells injected. X-axis is the number of days and Y-axis is tumor volume (mm3). Data are shown as means ± SD. (D, E) Pictures of injected tumors 1 × 10³ cells and a mouse. (F) Numbers of tumors generated and results of limiting dilution assay. Numbers of tumors generated by the cell lines are shown in table. Stem cell frequencies and 95% confidence intervals were calculated using ELDA as described in experimental procedures. All statistical analyses for this Figure were performed using bilateral Student's t test. P-values are shown as follows: *< 0.05, **< 0.01.

