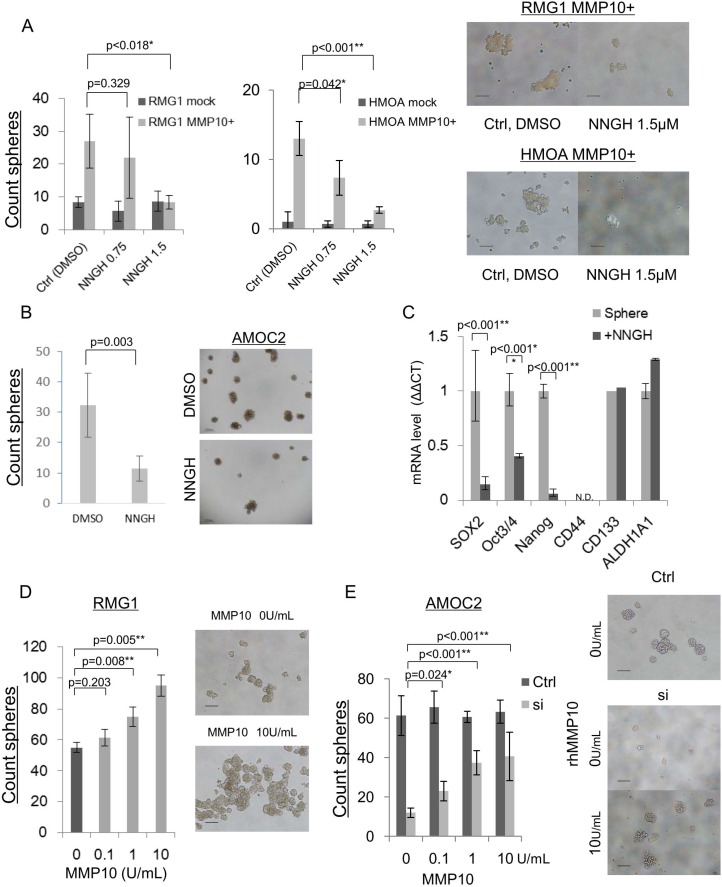
Figure 5. MMP10 inhibition and administration of recombinant human MMP10 protein.
(A) NNGH inhibition of sphere-forming ability in mock and MMP10-overexpressed cells. Number of spheres in each dilution of NNGH (DMSO, 0.75 μM, 1.5 μM) and in each cell line, RMG1 and HMOA. Data are shown as means ± SD. (B) NNGH inhibition of sphere-forming ability in AMOC2 cells. Number of spheres in each dilution of NNGH (DMSO, 1.5 μM). Data are shown as means ± SD. The upper pictures are spheres at day 3 after starting culture and the lower pictures are spheres at day 7 in each dilution of NNGH. (C) Down-regulation of stem related genes after NNGH administration. Results of quantitative PCR for stem cell-related genes during a period of 6 hours after NNGH administration are shown. The ΔΔCT method was performed using 0 h value as a control. Data are shown as means ± SD. (D) Administration of recombinant human MMP10 for RMG1 sphere-forming assay. Counted a number of spheres in each dilution (0, 0.1, 1, 10 U/mL) of recombinant human MMP10. Data are shown as means ± SD. (E) Administration of recombinant human MMP10 after MMP10 gene knockdown mediated by siRNA. Number of spheres in each dilution (0, 0.1, 1, 10 U/mL) of recombinant human MMP10-containing medium for MMP10 knockdown cells. Data are shown as means ± SD. All statistical analyses for this figure were performed using bilateral Student's t test. P-values are shown as follows: *< 0.05, **< 0.01.

