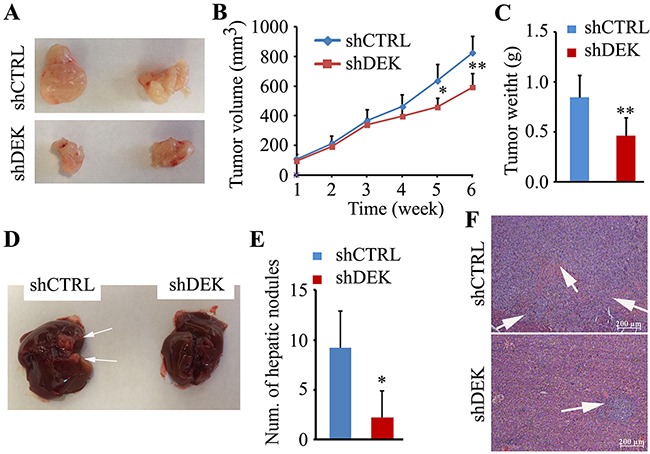
Figure 3. Knockdown of DEK suppresses tumor growth and metastasis in vivo.

A. Representative images showing xenograft tumors at day 42 post subcutaneous injection (n=5). B, C. Tumor sizes measured and depicted as tumor volume (B) or tumor weight (C). D. Representative images showing metastatic liver nodules in nude mice by splenic-vein injection of DEK knockdown SMMC7721 cells and the knockdown control cells. The arrows indicate the metastatic tumor on the surface of the liver. E. The numbers of nodules were quantified on nude mice livers (n=5). F. H&E staining was performed on serial sections of metastatic tumors and normal liver (×200). The arrows show the tumor foci in mouse liver section. Data are represented as mean ± SEM. **P<0.01.
