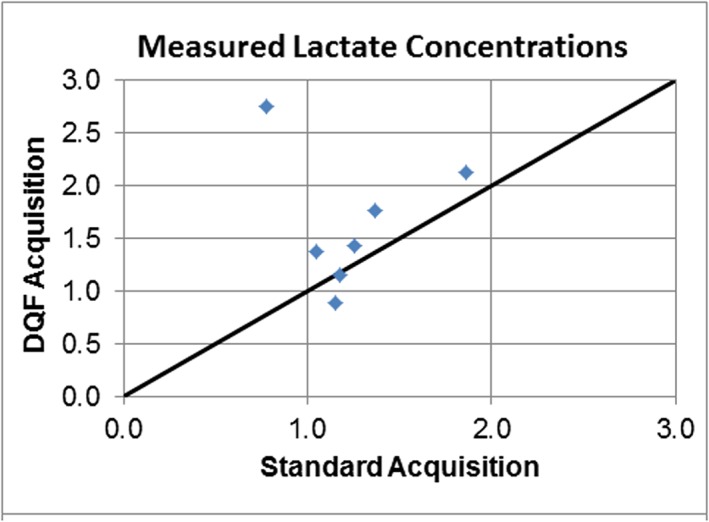
Figure 2.

Comparison of lactate concentrations measured using standard acquisition and DQ‐filtered acquisition. The line of identity is indicated. The two measurements yield similar results, except for the outlier with the DQ‐filtered concentration of 2.75 mM. This corresponds to the case shown in Figure 1B, in which the lactate is strongly overlapped with lipid.
