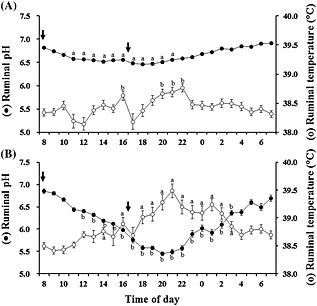
Figure 2.

Circadian changes in 1‐h mean ruminal pH (black circles) and temperature (white circles) in cattle fed the control diet (C‐diet, A) or the rumen acidosis‐inducing diet (RAI‐diet, B). Arrows indicate the feeding times. Values represent mean ± SE (n = 8). a P < 0.05, b P < 0.01 (significant difference compared to the 1‐h mean at 08.00‐09.00 hours in each group).
