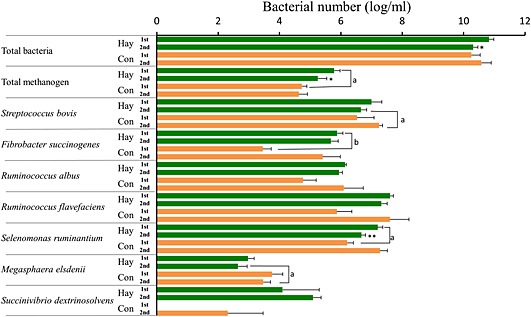
Figure 7.

Comparison of rumen bacterial numbers in cattle (n = 4) fed hay and concentrate (Con) in the first and second experiment by real‐time PCR. The bacterial number was analyzed using bacterial DNA extraction from fluids collected at 20.00 hours. Values represent mean ± SE (n = 4). * P < 0.05, ** P < 0.01 (significant difference compared to the first experiment in the same feeding), a P < 0.05, b P < 0.01 (significant difference between the hay‐ and concentrate‐feeding within the same experimental period).
