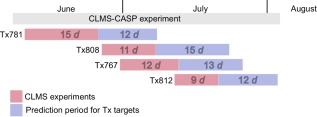
Figure 2.

Schedule of CLMS experiments and prediction periods for Tx targets in CASP11. Each colored bar shows the experimental CLMS time (in days, d) spent on each target and (red) and the prediction period that this target was available for prediction groups (blue).
