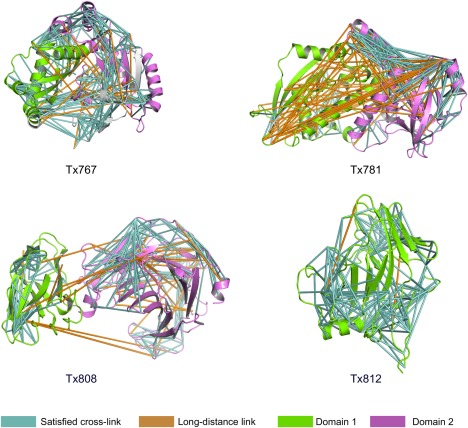
Figure 3.

Visualization of cross‐links in target proteins. Cartoon representation of protein target structures with cross‐links obtained by the proposed photo‐CLMS procedure. Cross‐links that satisfy the upper distance bound (<25 Å Cα‐Cα distance) are shown in cyan, long‐distance links that exceed the upper bound in orange. The first domain of the target is shown in green, the second in violet. Tx767: The cross‐links are evenly distributed in the protein. Most long‐distance cross‐links are between domain 1 and domain 2. Tx781: Domain 1 and the domain 1 ‐domain 2 interface contain many long‐distance cross‐links. Domain 2 has more links, but they are unevenly distributed. Tx808: Domain 1 has almost no long‐range cross‐links, but the domain is quite small. Many links can be found in domain 2, but almost no links are identified between β‐strands. Tx812: CLMS experiments produced almost only true‐positive links for this protein. However, there are again almost no links between β‐strands.
