Figure 4.

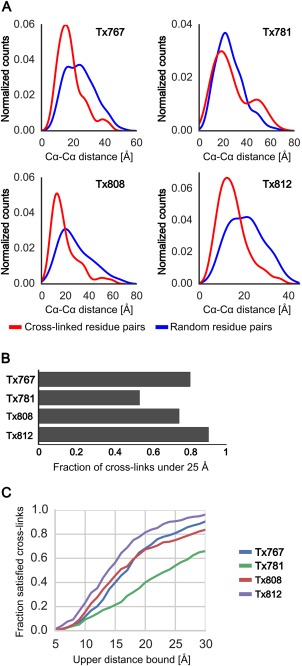
Structural information of CLMS data for four CASP11 targets. Only cross‐links with sequence separation of 12 amino acids or higher are considered for this plot, which results in: 393/332/221/216 links for Tx767/Tx781/Tx808/Tx812. A: α‐carbon distance distribution of cross‐linked residue pairs (red). Distances are taken from the native protein structure. The blue line shows a distance distribution of random residue pairs with the same sequence separation as the cross‐links. Except for Tx781, the distance distribution of cross‐linked residues significantly differs from the random distribution. B: Fraction of satisfied links with an upper distance bound of 25 Å. C: Fraction of satisfied cross‐links as a function of the upper distance bound. The upper distance bound might be lowered at the expense of cross‐link accuracy.
