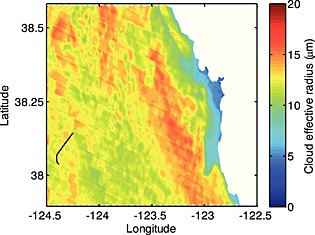
Figure 4.

Sample of 1 km MODIS effective radius (r e) in the MASE study area for 19 July 2005 taken from the TERRA MODIS cloud product at 19:25 UTC. Black line represents the G1 flight path for the vertical cloud penetration at 19:26:14–19:29:42 UTC.
