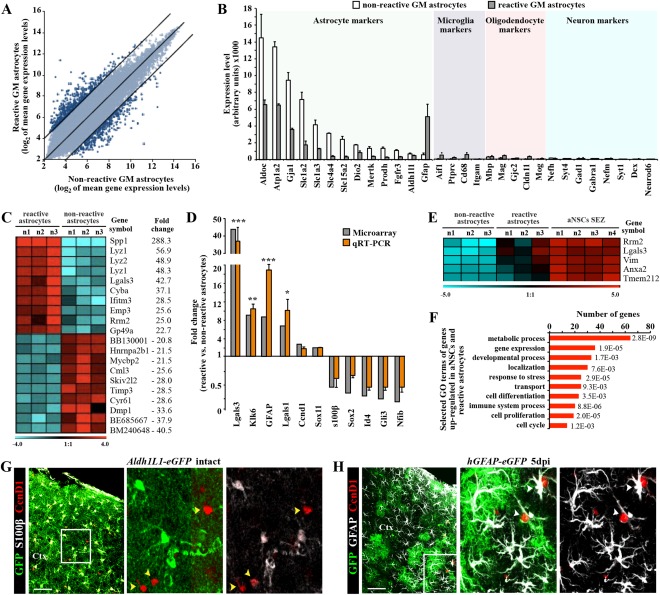
Figure 3.

Genomewide expression analysis of astrocytes from the intact or injured cerebral cortex GM. (A) Scatter plot of whole genome expression profile in nonreactive (Aldh1L1‐eGFP) and reactive (hGFAP‐eGFP) astrocytes depicted at normalized expression levels of all probe sets from the Affymetrix GeneChip Mouse Genome 430 2.0 arrays presented on log2 scale. Black lines indicated boundaries of twofold difference in gene expression levels. (B) Both isolated astrocyte populations express high level of astroglia‐specific genes. The y‐axis represents normalized expression of probe sets for cell‐type‐specific markers from the array. (C) Heat map showing the top 20 genes that significantly differ between astrocytes from intact or injured cerebral cortex (the normalized values are plotted on a log2 color scale, and color indicates up‐ (red) and downregulation (blue), as compared with the mean and linear fold changes (reactive vs. nonreactive astrocytes) are provided). (D) Transcript levels of several genes were confirmed by quantitative RT‐PCR and are shown in comparison to GeneChip expression levels. Data are plotted as mean ± SEM from independent biological/technical replicates. Significance between experimental groups was analyzed using of two‐tailed unpaired Student's t‐test and indicated as *(P < 0.05), **( P < 0.01), ***( P < 0.001). (E) The top five genes significantly enriched in both reactive astrocyte and adult neural stem cells (aNSC SEZ; see Beckervordersandforth et al., 2010) in comparison to the non‐reactive astrocytes are shown as a heat map as described above (for complete list, see Table 2). (F) Bars show 10 selected major GO classes associated with genes significantly enriched in both reactive astrocytes and aNSCs. (G, H) Immunofluorescence for cyclin D1 (in red) in frontal sections of intact (G) or injured (5 dpi, H) cerebral cortex confirm the injury‐induced expression of cyclin D1 (Ccnd1) in reactive astrocytes (white arrowheads), while astrocytes in the intact GM do not express cyclin D1 (yellow arrowheads). The cell nuclei were counterstained with DAPI. Scale bars: (G, H) 100 μm.
