Figure 1.

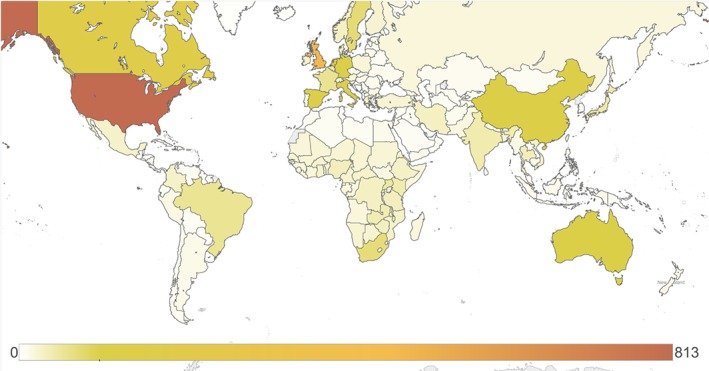
Number of economic evaluations set in each country. The intensity of shading reflects the number of economic evaluations analyzing each country over the 28‐month period from 1 January 2012 to 3 May 2014

Number of economic evaluations set in each country. The intensity of shading reflects the number of economic evaluations analyzing each country over the 28‐month period from 1 January 2012 to 3 May 2014