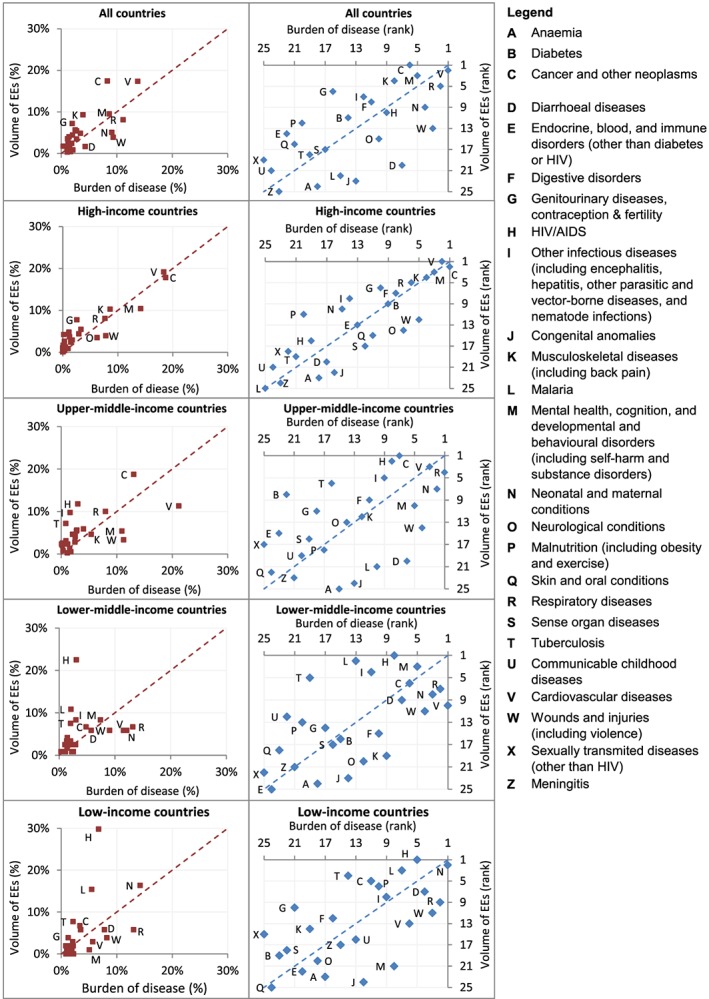
Figure 2.

Economic evaluations versus burden of disease by income group. Results are presented in two ways: the lefthand column compares the proportion of the total number of economic evaluations examining each of the 25 health area with the proportion of the total burden of disease accounted for by each health area and the righthand column compares the ranking of the health areas by the volume of economic evaluations and by burden of disease
