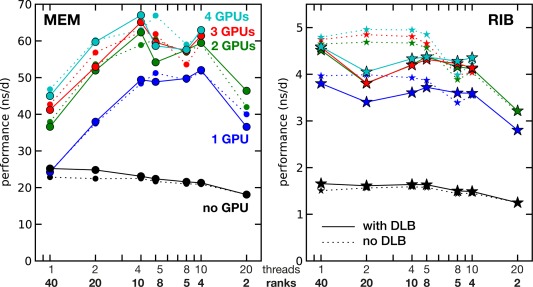
Figure 3.

Single‐node performance as a function of the number of GPUs (color coded) and of how the 40 hardware threads are exploited using a combination of MPI ranks and OpenMP threads. Solid lines show performance with, dotted lines without DLB. Test node had 2×E5–2680v2 processors and 4× GTX 980+ GPUs. Left panel MEM, right panel RIB benchmark system.
