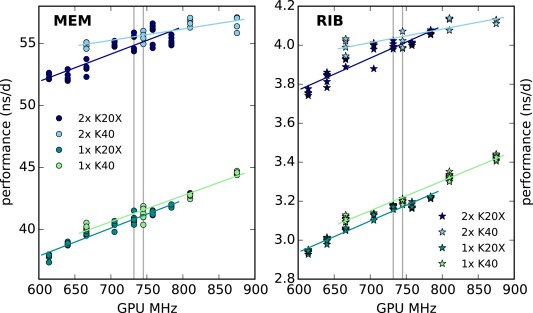
Figure 4.

Performance as a function of the GPU application clock rate on a node with 2×E5–2680v2 processors and K20X (dark blue, dark green) or K40 (light blue, light green) GPUs. Gray vertical lines indicate default clock rates. MEM, circles (RIB, stars) benchmarks were run using the settings found in Table 6 (Table 7).
