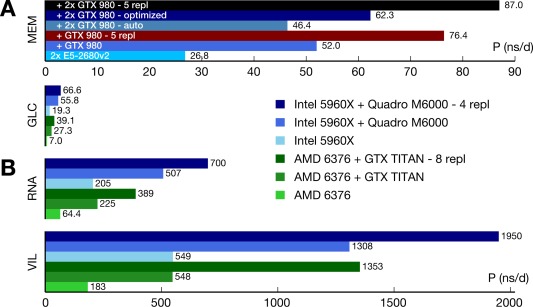
Figure 5.

Maximizing throughput by running multiple simulations per node. a) Single‐simulation performance P of the MEM benchmark on a node with 2×E5–2680v2 CPUs using 0, 1, or 2 GTX 980+ GPUs (blue colors) compared to the aggregated performance of five replicas (red/black). b) Similar to (a), but for different node types and benchmark systems (Available at: http://www.gromacs.org/gpu and ftp://ftp.gromacs.org/pub/CRESTA/CRESTA_Gromacs_benchmarks_v2.tgz). GLC–144 k atoms GluCL CRESTA benchmark, 1 nm cutoffs, PME grid spacing 0.12 nm. RNA–14.7 k atoms solvated RNAse, 0.9 nm cutoffs, PME grid spacing 0.1125 nm. VIL–8 k atoms villin protein, 1 nm cutoffs, PME grid spacing 0.125 nm. In (b), a 5 fs time step and GROMACS 5.0.4 was used. [Color figure can be viewed in the online issue, which is available at wileyonlinelibrary.com.]
