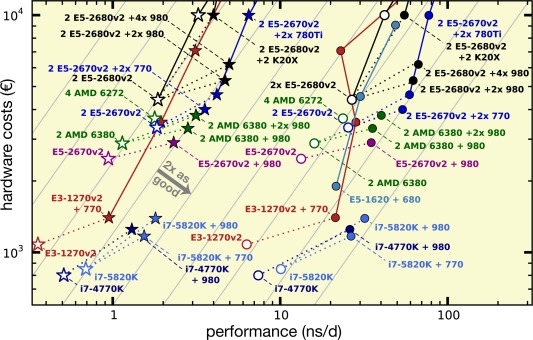
Figure 6.

Benchmark performances in relation to the total hardware investment (net) for investments up to 10,000 €. MEM (circles) and RIB (stars) symbols colored depending on CPU type. Symbols with white fill denote nodes without GPU acceleration. Dotted lines connect GPU nodes to their CPU‐only counterparts. The gray lines indicate constant performance‐to‐price ratio, they are a factor of 2 apart each. For this plot, all benchmarks not done with GCC 4.8 (see Table 2) have been renormalized to the performance values expected for GCC 4.8, that is, plus ≈19% for GCC 4.7 benchmarks on CPU nodes and plus ≈4% for GCC 4.7 benchmarks on GPU nodes (see Table 5). The costs for multiple node configurations include 370 € for QDR IB adapters (600 € per FDR‐14 IB adapter) per node. [Color figure can be viewed in the online issue, which is available at wileyonlinelibrary.com.]
