
Figure 1.
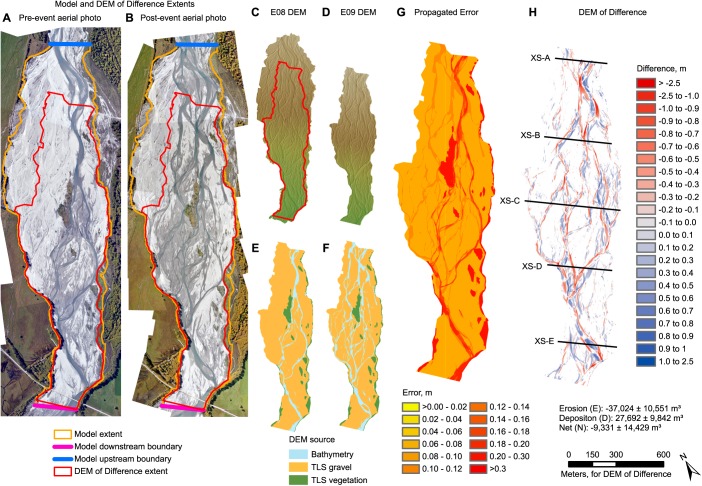
Morphological model domain and DoD. Aerial photos of study area acquired (a) before and (b) after a 227 m3 s−1 high‐flow event, showing extents of morphological model domain and DoD. DEM acquired (c) before and (d) after the high‐flow event. Note that the post‐storm DEM has a smaller spatial extent than the pre‐storm DEM. Comparisons between the observed and predicted DoDs are thus restricted to the extent of the observed DoD. Techniques used to survey topography for (e) pre‐event and (f) post‐event DEMs. (g) Combined propagated error for probabilistic DoD thresholding at 87% Confidence Interval. (h) DoD showing location of cross sections used to compare observed and predicted bed levels.