
Figure 2.
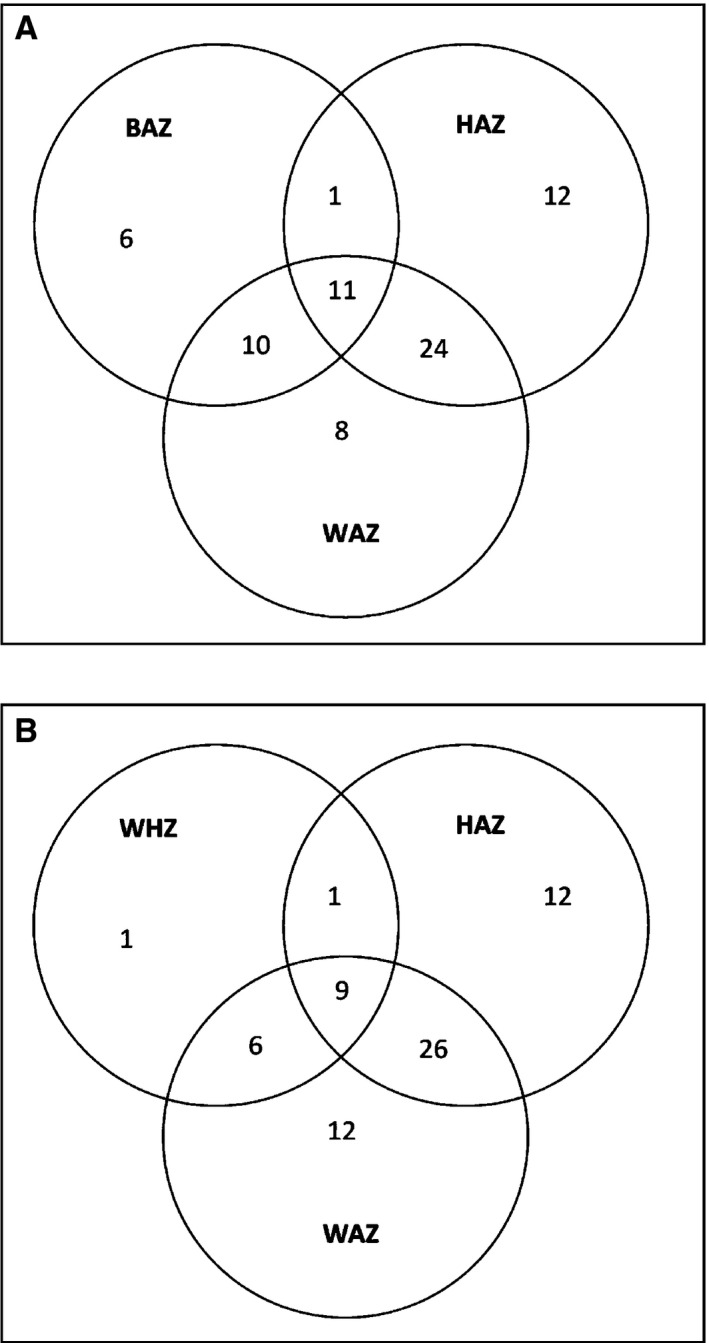
Venn diagrams to illustrate the relationship between nutritional status and various factors among the children, classified by the anthropometric indicators of (A) thinness [BMI‐for‐age Z‐score (BAZ)], stunting [height‐for‐age Z‐score (HAZ)] and underweight [weight‐for‐age Z‐score (WAZ)] in two to 12 year olds and (B) wasting [weight‐for‐height Z‐score (WHZ)], stunting [height‐for‐age Z‐score (HAZ)] and underweight [weight‐for‐age Z‐score (WAZ)] in two to 5 year olds. The overlap between the different indicators is illustrated. Regarding weight for age, the Z‐scores for four children were omitted because of outlier values. A further four children >10 years of age were not included in this calculation. Similarly, height‐for‐age Z‐score results for seven children and BMI‐for‐age Z‐score results for four children were excluded from this calculation because of outlier values. Finally, with regard to weight‐for‐height Z‐score, only 94 children ≤5 years old were included in the calculation.