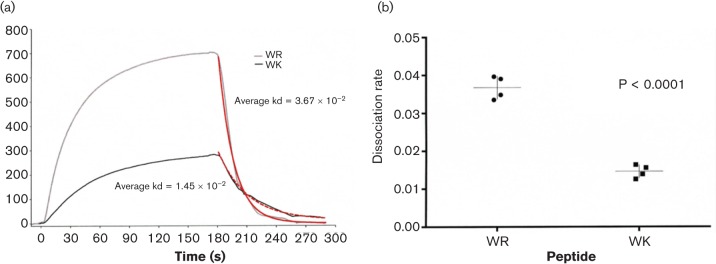
Fig. 3.
eCAP binding differences to live P. aeruginosa. WK12 and WR12 peptide binding to PAO1 was detailed using SPR. (a) A representative curve for each peptide is displayed. Sensogram plot provides binding over time, where association is visualized as an increasing response, during which PAO1 was flowed over immobilized peptides including the negative control peptide T20, an HIV fusion inhibitor. Dissociation is visualized as a decreasing response, during which PAO1 was replaced with buffer. Red lines indicate dissociation rates determined using BIAevaluation software. (b) WR12 demonstrated a significantly faster dissociation rate as compared with WK, determined with via unpaired t-test (P < 0.0001) in the GraphPad software package.

