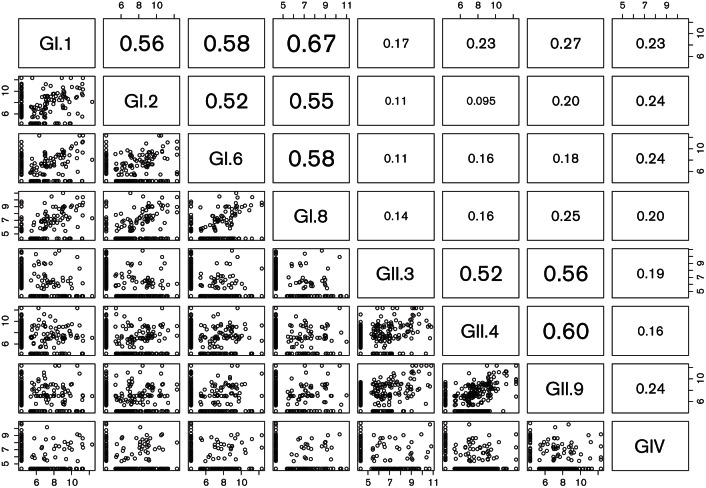
Fig. 1.
Multiple scatterplot log-transformed titres of children <5 years (n=649) to determine potential cross-reactive patterns among P particle antigens on the protein array platform. In the top right triangle Spearman correlation coefficients are plotted between each antigen pair, with significant numbers being highlighted by enlargement.

