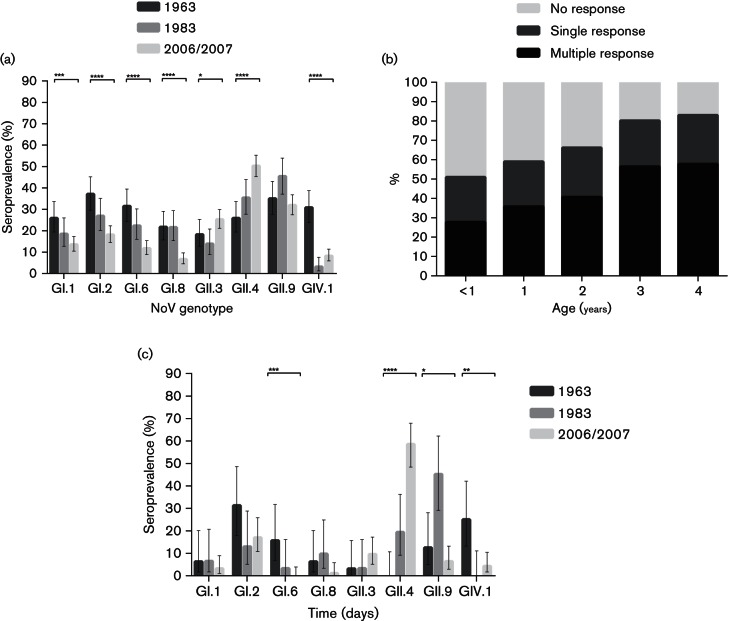
Fig. 3.
Comparison of norovirus seroprevalence (n=649) stratified to cohort and genotype (a). Age-related broadening of the norovirus immune response (n=649) (b). Comparison of norovirus seroprevalence in sera (n=157) with single response stratified to cohort and genotype (c). Error bars indicate binomial proportion confidence intervals (Wilson score interval). Brackets above bars show significance level as determined by chi-squared test for trend. No bracket = P>0.05, *P≤0.05, **P≤0.01, ***P≤0.001 and ****P≤0.0001.

