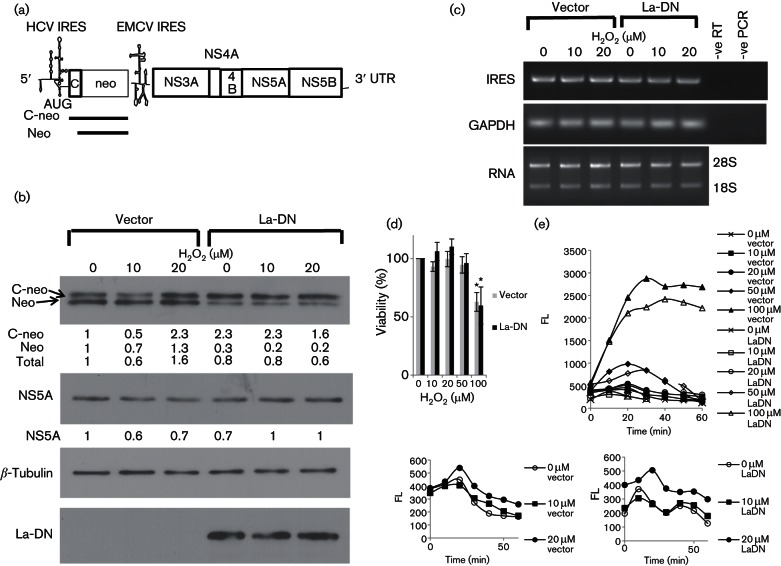
Fig. 8.
La-DN inhibits H2O2-activated translation in a sub-genomic replicon cell line. (a) Diagrammatic representation of the sub-genomic replicon used in this study. The sub-genomic replicon consists of a bicistronic transcript in which expression of the core (1–15 aa)-neomycin phosphotransferase (C-neo) fusion protein is under the translational control of the HCV IRES element, whereas expression of the HCV non-structural (NS) 3-NS5B polyprotein is under the translational control of the EMCV IRES element. (b) Western blots showing the levels of the C-neo/neo proteins, NS5A, myc-tag dominant-negative La (La-DN) mutant protein and the internal loading control β-tubulin in whole-cell lysates of Huh8 cells transfected with either the empty vector or a vector expressing the La-DN mutant protein and treated with doses of H2O2, as indicated, for 1 h. The following concentrations were used: (anti-neo antibody clone 4B4D1, Sigma, 1 : 1000; anti-mouse HRP 1 : 500); (NS5A clone 9E10 1 : 50; anti-mouse HRP 1 : 1000); (anti-myc clone A-14, Santa Cruz 1 : 1000; anti-rabbit HRP 1 : 1000); (anti-β-tubulin clone TUB2.1, Sigma 1 : 1000; anti-mouse HRP 1 : 1000). The levels of C-neo, neo and NS5A were quantified using ImageJ, normalized against β-tubulin and expressed as fold increase relative to the 0 µM H2O2 vector control. (c) Agarose gel electrophoresis showing the amplified fragments from RT-PCR using primers specific for the HCV IRES element and the internal control glyceraldehyde 3-phosphate dehydrogenase (GAPDH) in Huh8 cells transfected with either the empty vector or a vector expressing the La-DN mutant protein and treated with doses of H2O2, as indicated, for 1 h. –ve RT, Negative control for the RT reaction; –ve PCR, negative control for the PCR. The bottom panel shows equal quantity of RNA had been used in the RT-PCR. The bands are the 28S and 18S ribosomal RNAs. (d) XTT assay showing viability of Huh8 cells (16 000 per well/96-well plate) after treatment with doses of H2O2, as indicated, for 24 h. The values obtained represent the mean ± sem of three independent experiments, performed in quadruplicates, and are expressed relative to the untreated control, which is set as 100 %. Significance of the difference *P<0.05. (e) A representation of three independent dichlorofluorescin fluorometric assays, performed in quadruplicates, showing the kinetics of ROS generation in Huh8 cells (16 000 per well/96-well plate) after treatment with doses of H2O2, as indicated. The bottom part of the graph is enlarged and depicted below to show ROS generation in the lower range of H2O2. FL, Fluorescence units.

