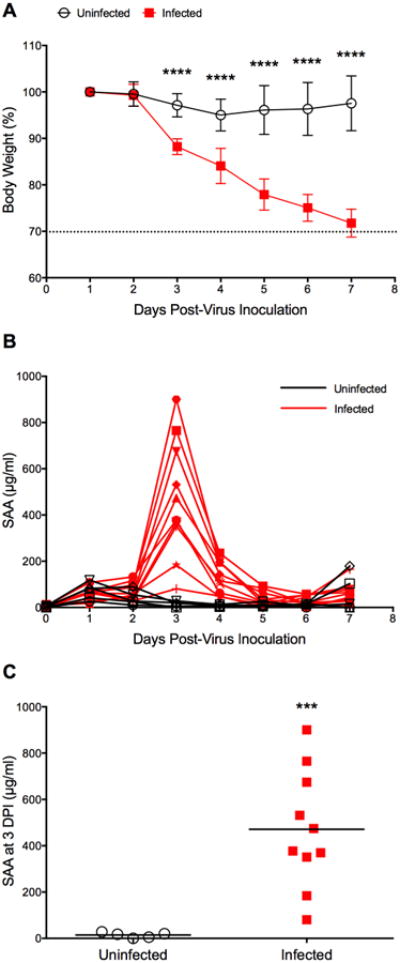
Fig. 2.

Time course of SAA in BALB/c mice infected with influenza A/California/04/2009 (H1N1)pdm09 virus. Mice (n=10) were intranasally infected with virus (1LD90). Control animals (uninfected, n=5) received dilution vehicle (MEM) only. At specific time points (0-7 dpi), animals were cheek-bled for serum collection. The experiment was terminated 7 days post-virus inoculation. (A) Survival and body weight were monitored daily (survival data not shown since all animals were still alive at the end of the experiment). Body weight data are presented as the mean ± SD. The dashed line indicates 30% body weight loss. ****P < 0.0001 for days 3-7 dpi, compared with the uninfected control group; two-way ANOVA with Sidak's multiple comparison test. (B) Time course of SAA as determined in three independent ELISA assays of which one representative data set is shown here. (C) SAA levels in serum collected at 3 dpi. ***P = 0.0003, compared to uninfected control; unpaired t-test with Welch's correction.
