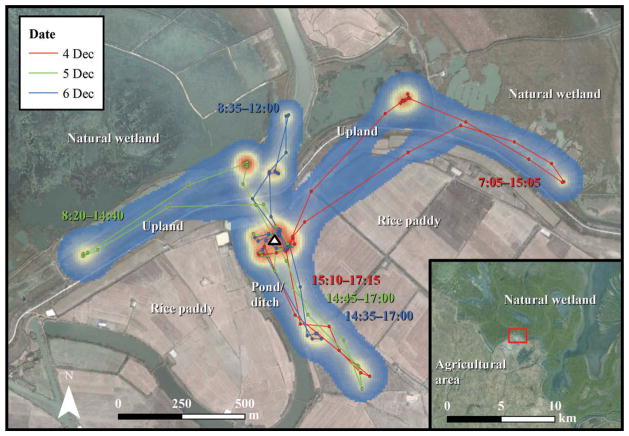
Figure 2.
Diurnal locations, paths and utilization distribution estimating relative use of a free-grazing domestic duck over three days in December 2007 near Poyang Lake. Blue shading indicates areas of relatively low use, while orange and red areas indicate areas of high use. Time labels are colored by date and correspond to individual foraging trips away from the farm shelter. White triangle denotes farm shelter. Red square on inset indicates farm location in relation to boundary between agricultural area and natural wetland. Base imagery source: Google Earth (version 7.1.2, Google, Mountain View, CA, 2015).

