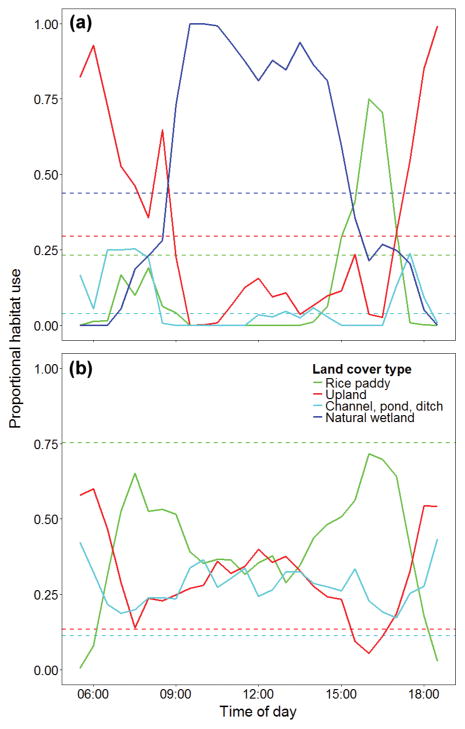
Figure 3.
Average proportional habitat use of habitat types within 50% UD contours bounding 30 min time steps for (a) 20 birds at farms > 1.5 km from natural wetlands and (b) 5 birds from farms ≤ 1.5 km from natural wetlands (border farms). Dashed horizontal lines represent the proportional availability of each habitat type within 1.5 km of farm center.

