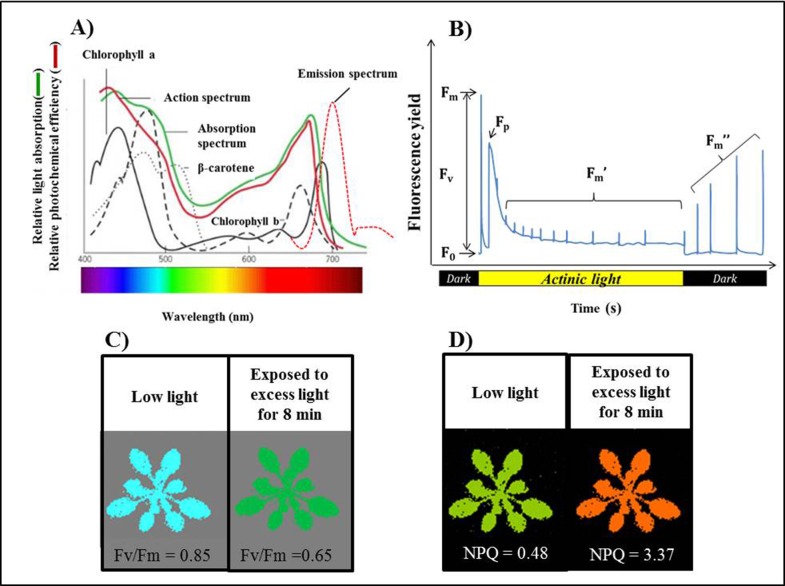
Figure 2.
The principles of Chlorophyll fluorescence.
(A) The model of absorption spectrum by different photosynthetic pigments (adapted from Karp, 2009). Reproduced with permission from John Wiley & Sons, Inc. © John Wiley & Sons, http://www.wiley.com. (B) Sequence of a typical Chlorophyll fluorescence trace measured in PlantScreen. F0 is minimum fluorescence and Fm the maximum fluorescence in the dark adapted. Fm’ represents maximum fluorescence in light. Fm” is the maximum fluorescence during dark relaxation. (C) Image of Fv/Fm for Col-0 grown under low light. The Fv/Fm values decreased from 0.85±0.03 to 0.65±0.08 when plants were exposed to excess light (750 µmol quanta m-2 s-1) for 8 min. (D) Image of NPQ measurement for Col-0 grown under low light. The NPQ values increased from 0.48±0.07 to 3.37±0.11 when plants were exposed to excess light for 8 min. Each data represent the mean (n = 16).

